Teaching with Visual Symbols

Objectives:
1. To identify the instructional materials fall under this category
2. To categorize examples of each visual symbols
3. To construct visual symbols where they can be integrated in the instructional process
4. To modify guidelines that must be followed when reading charts, graphs, and maps
ABSTRACTION
Your experience of the words and the graphs convinces you that a graph is easier to understand than the words of a paragraph. A graph is “worth a thousand words.” a graph and any visual symbol for that matter such as drawings, cartoons, strip drawings, diagrams and maps are worth a thousand words. They are more clearly understood than mere words. Let us learn more about each of them and find out where they can be used in our lessons.
A. Drawings

A drawing may not be real thing but better to have a concrete visual aids than nothing. To avoid confusion, it is good that our drawing correctly represents the real thing. One essential skills that a teacher ought to possess at order to be understood is drawing. It helps you a lot if you are capable of doing simple freehand sketching. You will find out that as you lecture, you need to illustrate on the chalkboard. So, better start learning how to draw. The only way to learn it is to do the sketching yourself and devote some time to it. There is nothing so difficult that is not made easy when we spend at least forty hours learning and mastering it.
B. Cartoons

Another useful visual symbols that can bring novelty to our teaching is the cartoon. A first-rate cartoon tells its story metaphorically. The perfect cartoon needs no caption. The less the artist depends on words, the more effective the symbolism. The symbolism conveys the message.
Sources of cartoons
You can easily collect cartoons for instruction. They appear often in newspapers and magazines. In class, you can give it to individual students for individual study or project it by an opaque projector. Depending on themes for the week of the month, you can display these cartoons on the bulletin board. One creative teacher arranged for a “ cartoon of the month” and displayed and changed her display every end of the month.
Where to use cartoons in instruction
you can also use this as a springboard for a lesson or a concluding activity. It depends on your purpose.
K to 12 curriculum standards and competencies
go back to the K to 12 curriculum guide. Which can be taught with the use of a cartoon? Come up with a cartoon for a particular lesson.
C.Strip drawing

These are commonly called comics or comic strip. Dale (1969) asserts that a more accurate term is strip drawings. Make use of strip that are educational and entertaining at the same time.
Where to use strip drawing in instruction
these can serve as motivation and a starter of your lesson. It can also be given as an activity for students to express insightss gained at the conclusion of a lesson.
Source of strip drawing
you can obtain strip drawings from newspapers, magazines and books
K to 12 curriculum standards and competencies
identify a competency where a strip drawing is appropriate. Look for an appropriate strip drawing or make one.
D. Diagram
What is a diagram? It is “ any line drawing that shows arrangement and relations as of parts to the whole, relative values, origins and development, chronological fluctuations, distribution etc.” (Dale, 1969)
If you can draw stick figures, you can easily draw the diagrams that you need as you go along. To emphasize the key points in your diagram, make use of color whether you use the chalkboard of the OHP and transparenicies.
types of a diagram
Find out what these other diagrams are. You may nedd them as you teach and as you go about you other teaching-related tasks.
·
 Affinity diagram-used to cluster complex apparently unrelated data into natural and meaningful groups.

·
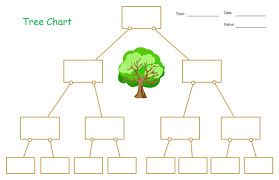
 Tree diagram- used to chart out, in increasing detail, the various tasks that must be accomplished to complete a project or achieve a specific objective.
·
 Fish-bone diagram- it is also called cause and effect diagram.it is a structured form of brainstorming that graphically shows the relationship of possible cause and sub -causes directly related to an identified effect / problem. It is most commonly used to analyze work-related problems.

E. Chart
A chart is a diagrammatical representation of relationships among individuals within an organization. We can have a: 1.) time chart, 2.) tree or stream chart, 3.) flow chart, 4.) organizational chart, 5.) comparison and contrasts chart, 6.) pareto chart and 7.) run chart or trend chart.
Examples of chart
·
 Time chart- is a tabular time chart that presents data in ordinal sequence.

·
 Tree or stream chart- depects development, growth and change by beginning with a single course (the trunk) which spreads out into many branches; or by beginning with the many tributaries which then converge into a single channel.

·
 Flow chart- is a visual way of charting or showing a process from beginning to end. It is a means of analyzing a process. By outlining every step in a process, you can begin to find ineffeciencies or problems. (Latta, 1994)

·
 Organizational chart- shows how one part of the organizational relates to other parts of the organizationa.

·
 Comparison and contrasts- used to show similarities and differences between two things (people, places, events, ideas, etc.)·

·
 Pareto chart- is a type of bar chart, priorritized in descending order of magnitude or importance from left to right. It shows at a glance which factors are occuting most.
·
 Gannt chart- is an acivity time chart.

K to 12 standards and competencies
Find out which of these charts are appropriate for any lesson in the K to 12 curriculum guide or for any teaching related tasks.
F. Graphs
These are several types of graphs. They are :1.) circle or pie graph, 2.) bar graph, 3.) pictorial graph and 4.) line graph.
·
 Pie or cicle graph- recommended for showing parts of whole.

·
 Bar graph- used in comparing the magintude of similar items at different ties or seeing relative sizes of the parts of a whole.

·
 Pictorial graph- makes use of picture symbols.

·
 Graphic organizers- you met several graphic organizers in your subject, principles of teaching.

G. Maps
A maps is a “representation of the surface of the earth or some part of it...” (Dale 1969)
kinds of map
·
 physical map- combines in a single projection data like altitude, temperature, rainfalll, precipitation, vegetation, and soil.

·
 Relief map- has three dimensional representations and shows contours of the physical data of the earth or part of the earth.

·
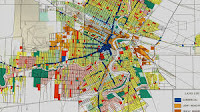 Commercial or economic map- also called product or industrial map since they show land areas in relation to the economy.

·
 Political map- gives detailed information about country, provinces, cities and towns and roads ang highways. Oceans, rivers and lake are the main features of most political maps.

Map language
·


Scale- shows how much of the actual earth's surface is presented by a given measurement on a map. The scale musr be shown so that the map reader can use the distances and areas shown on the map in measuring or figuring out the real distance and areas on the earth's surface. On some maps, scale is shown graphically. In others the scale is expressed in words and figure.e.g. 1 inch – 15 statute miles. 3
·
 Symbols- usually a map has a legend that explains what each symbols means. Some symbols represent highways, railroads, mountains, lake and plains.

·
 Color- the different colors of the map are parts of the map language.

·
 Geographic grids- the entire system of these grid lines. These grid lines are called meridians and parallels. A meridians is a north to south pole line. Parallels are lines drawn around a globe with all points along each line with an equal distance from the pole. Longitude is the distance in degree of any place east or west of the prime meridians. Latitude is the distance in degrees of any place north and south of the equator.

Map reading test
Here is a map reading test. Test your self. Don't you worry, if you don't perform well at first. After further reading about maps, take the test again. Do it until you get a perfect score. If you work hard at it, you will not be hard up presenting or teaching your students about maps later.
A map-reading test

A number of studies have been made of the ability of pupils to read maps and, in general, the findings are disappointing. Many students have not mastered simple map-reading skills before they leave junior high school. Further, studies show that geographical errors common to pupils are also common among teachers. Encircle the T if the statement is correct and F if the statement is wrong (adapted from audiovisual methods in teaching, by Edgar dale, (1969)
lines of longitude are parallel to each other. T F · on a globe all lines of latitude meet at the poles. T F · a degree of longitude ranges from 68.4 to 69.4 miles. T F · longitude is usually measured from greenwich, England. T F · latitude is measured from the equator. T F · the latitude of the poles isa 90 degrees. T F · the hours of daylight in summer and winter are related to longitude. T F · places at low latitudes usually have warm climates. T F · time belts are directly related to longitude. T F · the latitude of a place indicates its distance from the equator. T F · the highest latitudes are around the poles. T F · a place not on the equator must be either north or south of it. T F · lines of longitude bisect the earth. T F · latitude means angular distance north or south of the equator. T F · longitude 0 degree defines an exact place on the earth. T F · lines if latitude are parallel to the equator. T F · latitude 90 degree north define an exact place on the earth. T F · any place not on the Greenwich Meridian is either east or west of it. T F · a place of 40 degree latitudes is about 1,000.3,000,5,0000,8,000 miles from the T F equator · a line of longitude is also called a meridian. T F · the longitude of a place gives a rough indication of its climate T F · a line of latitude is referred to as a parallel. T F
understand the maps, graphs and charts
What should you to do be successful in reading maps, charts and graphs? The following steps will be help of you:
· Read the titles and subtitles. They will often tell you the purpose of the graphic materials and may provide a clue to its main idea.
· Read the key, and / or the legend, and the scale of miles whenever any of these is present. (these items ordinarily appear on maps.) ·read the information shown along the side and the bottom of graphs and chart and tables, if any. This will help you understand what quantities or qualities are being presented or what comparisons are being made. On maps, notice how the different parts of the map are related to each other.
·
Determine your purpose for reading the map, chart, table or graph.
Walang komento:
Mag-post ng isang Komento